This article describes forage quality, how and why constituents are determined and guides how to interpret forage quality tests.
There are sensory, physical, chemical, biological and instrumental methods for determining forage quality.
All methods depend on proper forage sampling. Because only a small quantity is analyzed, the sample must be representative of the entire lot of forage.
For more information on sampling forages, see the National Forage Testing Association website and Proper Sampling (Coring) of Hay Bales and Stacks and the Idaho Forage Handbook (BUL547) from the University of Idaho website.
Feed analysis reports contain the following information:
- Moisture – Forage moisture content is used to calculate constituents on a dry matter (DM) and on “as received” or wet basis. Forages should be compared for their nutritive value on the DM basis.
- Protein – Grasses typically have 4 to 16 percent crude protein (CP). Legumes have 10 to 25 percent CP depending on soil fertility, plant species and plant maturity. If the test value is greater than 25 percent CP, you should test for nitrates and expect that some CP is actually non-protein nitrogen.
- Acid detergent insoluble nitrogen (ADIN) or acid detergent insoluble crude protein (ADICP) are indicators of unavailable nitrogen which may be the result of heat-damaged protein. Heat damage occurs when forage heats above 140 degrees, causing sugars and amino acids to combine, forming indigestible compounds appearing like lignin.
- Fiber – or structural carbohydrate – supplies a highly variable amount of energy to the diet because digestibility varies greatly. Fiber is most often reported as acid detergent fiber (ADF) and neutral detergent fiber (NDF).
- Neutral Detergent Fiber (NDF) – This is fiber that remains after part of the digestible cell wall is removed with a neutral detergent. NDF varies from 30 percent NDF in fresh alfalfa to 60 percent in mature straws and tropical grasses. NDF is related to animal intake of the forage: as NDF increases, intake decreases. Digestible NDF (NDFD) is a better indicator of energy content of forage. Legume forages generally have lower NDF than grasses, but the NDFD in grasses may be higher.
- Acid Detergent Fiber (ADF) – This is fiber that remains after part of the digestible cell wall is removed with an acid detergent. ADF is related to forage digestibility: as ADF increases, digestibility decreases.
- Energy – Energy is not directly measured but is commonly predicted. Total digestible nutrients (TDN) is the best practical prediction of forage energy as properly determined by a summative equation developed at Ohio State University.
- Total Digestible Nutrients (TDN) – TDN represents the sum of all digestible nutrients in the forage, crude protein + 2.25 (fat) + non-structural carbohydrates + digestible NDF. However, TDN is often crudely estimated from ADF and may not be identified as such.
- Minerals – Minerals important to forage analysis include phosphorus (P), calcium (Ca), potassium (K) and magnesium (Mg).
Secondary measured values from laboratory analysis
- Total N – nitrogen content (percentage of DM)
- DIN – rumen-degradable intake nitrogen (percentage of total N)
- UIN – rumen-undegradable intake nitrogen (percentage of total N)
- ADFN – acid detergent fiber N (percentage of total N)
Calculated values
- DM – dry matter (percentage) is calculated as 100 - moisture content
- Crude Protein (CP) – estimate of protein (percentage of DM) = Total N x 6.25
- Digestible Crude Protein (DCP) – (percentage of total CP) = CP x 0.72
- Digestible Dry Matter (DDM) – (percentage of DM) = 88.9 - (0.779 x ADF)
- DMI – dry matter intake (percentage of bodyweight) = 120 / NDF
- RFV – relative feed value index = (DDM x DMI) / 1.29
The National Forage Testing Association describes the purpose of calculating RFV below:
Digestible Dry Matter (DDM), Dry Matter Intake (DMI) and Relative Feed Value Index (RFV) calculations are applicable to legume, legume-grass and cool-season grass fresh forages, hays and haylages.
Relative feed value index is an index that ranks cool-season legumes, grasses and mixtures by potential digestible dry matter intake.
New developments in forage testing
A Michigan State University study found that, for each percentage point increase in NDF digestibility (NDFD), dry matter intake increased 0.37 pounds and 4 percent fat- corrected milk production increased 0.5 pounds.
The National Research Council (NRC) adopted the procedure of measuring digestibility of the NDF fraction. The NRC in Nutrient Requirements for Dairy Cattle recommends using NDFD in a revised summative equation to predict TDN. The equation below is used to predict TDN for legumes:
TDN legumes = (NFC x 0.98) + (CP x 0.93) + (FA x 0.97 x 2.25) + (NDFn x (NDFD/100) -7 where:
- CP = crude protein (percentage of DM)
- EE = ether extract (percentage of DM)
- FA = fatty acids (percentage of DM) = ether extract -1
- NDF = neutral detergent fiber (percentage of DM)
- NDFCP = neutral detergent fiber crude protein
- NDFn = nitrogen-free NDF = NDF - NDFCP, else estimated as NDFn = NDF x 0.93
- NDFD = 48-hour in vitro NDF digestibility (percentage of NDF)
- NFC = non-fibrous carbohydrate (percentage of DM) = 100 - (NDFn + CP + EE + ash)
Relative Forage Quality (RFQ) was developed by University of Wisconsin researchers to replace RFV. The TDN equation above is used to calculate RFQ as follows:
RFQ = (DMI, percentage of bodyweight) x (TDN, percentage of DM) / 1.23
where DMI is calculated as for RFV above. RFQ is more accurate in predicting forage utilization by animals, is more useful across different forage types such as grass and mixed hays and provides more separation of forage value than the RFV index.
Near-Infrared Reflectance Spectroscopy (NIRS) analysis
NIRS detects the absorption of near-infrared light by molecules based on calibrations derived from wet chemistry.
NIRS is rapid and less expensive than chemical laboratory analyses and NIRS is highly precise. The NIRS Forage and Feed Testing Consortium provides prediction equations that most university and commercial labs use.
Forage sampling and testing accuracy
Sampling is the largest source of error in forage analyses. Laboratory error is added to sampling error in test analysis.
Normally there might be +/- 5 percent variation (error) in results, e.g. +/- 1.5 percent ADF or +/- 8 RFV. Usually a test of 31.5 percent ADF is not different than 30 percent ADF and neither is a test of 172 RFV different than 180 RFV.
Forage quality evaluation and interpretation is a multifaceted system. Quality values are not absolute and forage quality is not adequately described by any one variable.
The National Forage Testing Association (NFTA) certifies the proficiency of laboratories for accuracy in testing hay and corn silage for dry matter, crude protein, ADF and NDF. Select an NFTA-certified lab so that variability due to analysis is minimized.
Websites with information about forage quality
National Forage Testing Association
University of Idaho Forage Extension
NIRS Forage and Feed Testing Consortium
Forage Quality and Testing, U of Wisconsin
References omitted due to space but are available upon request. Click here to email an editor.
Glenn Shewmaker is a forage specialist with the University of Idaho.
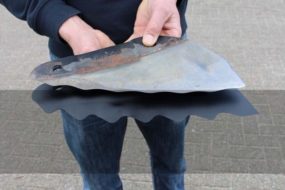
PHOTO
A sharp core tip inserted correctly will cut stems and retain leaves in the same proportion as in the bale.
Photo courtesy of Glenn Shewmaker.


