This report uses the most current information available as of April 6 to estimate the effects of the COVID-19 pandemic on the beef industry’s production sectors.
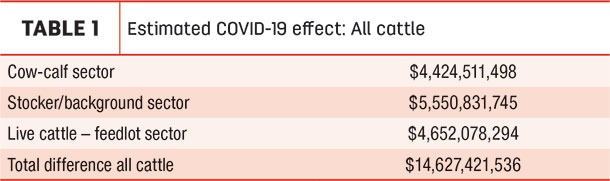
Using existing market data and futures market data, the total actual and future impact is forecast to exceed $14.6 billion, broken out by sector in Table 1.
The following report provides detail on the information sources and methods used to calculate this estimate.
Introduction
The Coronavirus Aid, Relief and Economic Security (CARES) Act was passed by Congress and signed into law by President Donald Trump on March 27, 2020. The package authorized over $2 trillion in economic relief to American people and businesses affected by the public health and economic impacts of COVID-19. The relief package included $14 billion for replenishment of USDA’s Commodity Credit Corporation and over $9 billion of direct assistance to the livestock, specialty crops and direct marketing industries.
News of the novel coronavirus began affecting cattle markets on Jan. 23 following reports of its discovery and human-to-human spread in the Wuhan province of China. Initially, cash markets reacted slowly, though the CME cattle futures sold off sharply. The countries of East Asia, particularly Japan and South Korea, account for the majority of beef exports, so the early futures market reaction may have resulted from anticipation of reduced beef export demand.
The market stabilized somewhat from Jan. 23 to Feb. 20. Cash markets remained strong, with weighted average live cattle prices ranging between $126 and $123. The CME Feeder Cattle Index trended slightly lower from $146 to $142 from Jan. 23 through Feb. 20, but the trend was slight and could easily have been a result of other factors.
Cattle futures sold off sharply the week of Feb. 20. April live cattle and April feeder cattle futures both closed $7 lower than the prior week. Since that time, live cattle and feeder cattle futures have declined steadily, with no signs of bottoming as of April 15.
Cash live cattle also trended sharply lower since Feb. 20, dropping as much as $12 from the highs prior to Jan. 23. This is especially notable because this time frame represents a marketing window when prices are at their highest level for the year. The feeder cattle index also trended lower and lost nearly $20 dollars from the high to the low from February through March.
The market action suggests that COVID-19 substantially impacted live cattle and feeder cattle markets. Moreover, the effects appear to continue through the fall. This report provides an estimate of the most likely effects on each of the three cattle production sectors with the data available to date.
Sectors
Three primary sectors of the cattle production chain have been affected by the COVID-19 pandemic and corresponding market reaction.
1. Feedlot sector
2. Stocker/backgrounding sector
3. Cow-calf sector
The stocker and cow-calf production sectors both have more than one marketing window and multiple production practices. This analysis considers two stocker marketing windows: spring and fall. The cow-calf sector markets calves in all months of the year, but an estimated 75% of calves are born in the late winter or spring and marketed in the fall. This analysis therefore separately estimates effects of COVID-19 on the two largest calf crops, which are spring and fall. Spring calves were assumed sold in October, and fall calf values were estimated for January 2021.
Cattle numbers
The report derives the number of animals in each sector from the NASS Jan. 1, 2020, cattle inventory. The calculations are shown below:
Feedlot sector
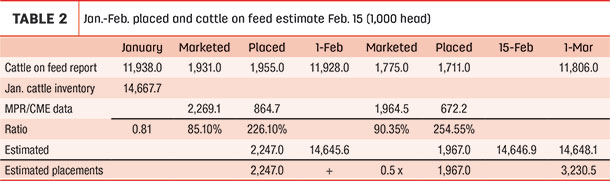
Cattle in the feedlot sector were based on the NASS Cattle on Feed report as of Feb. 1, 2020. The number was estimated starting with cattle on feed reported in the NASS inventory report and adjusted for cattle marketed and placed from Jan. 1 through Feb. 15. The following assumptions were used to make these calculations:
1. Marketed cattle were subtracted, per the NASS weekly Cattle Slaughter report.
2. Placements were based on the February and March Cattle on Feed reports and adjusted for small feedlots, assuming reported placements accounted for 87% of all placements.
3. Estimated placement calculations to Feb. 15 assumed one-half of total February estimates.
The final estimate of total cattle on feed as of Feb. 15 was calculated to be 14.65 million head. Calculations are shown in Table 2.
Spring stockers and backgrounding sector
Stocker and backgrounded calf numbers were estimated in two groups, spring and summer. Spring stockers were calculated using the January NASS inventory report of calves over 500 pounds. Adjustments are described as follows:
1. Heifers kept as replacements that will eventually be culled were added to other heifers to yield a total spring stocker estimate.
2. Cattle on feed per the NASS inventory report were subtracted from the total estimate.
3. Bull allowance was calculated as one-fourth the 10-year average bull-to-cow ratio in the January inventory report.
4. Estimates of steers and heifers on feed and placed were calculated using the NASS Jan. 1 Cattle on Feed reported ratio of steers to heifers.
5. Calves placed in January and February were based on the NASS Cattle on Feed reports and adjusted to account for placements in feedlots under 1,000 head.
Table 3 shows calculations of the estimated number of spring stocker and background cattle as of Feb. 15.
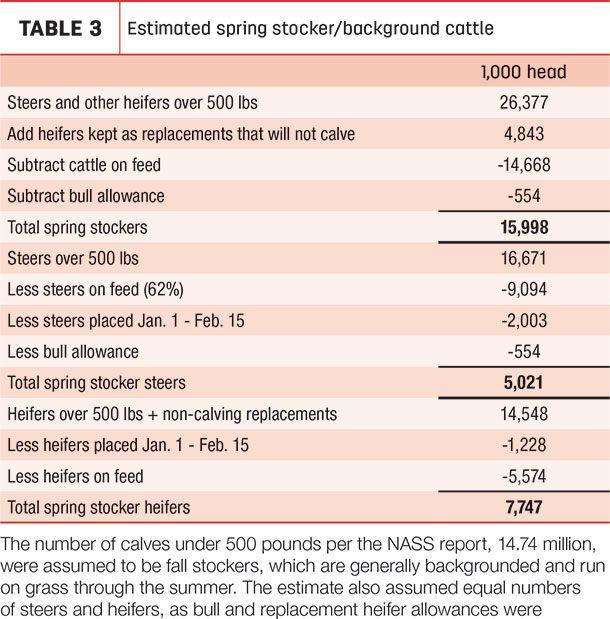
The number of calves under 500 pounds per the NASS report, 14.74 million, were assumed to be fall stockers, which are generally backgrounded and run on grass through the summer. The estimate also assumed equal numbers of steers and heifers, as bull and replacement heifer allowances were subtracted from the spring stocker numbers.
Cow-calf sector
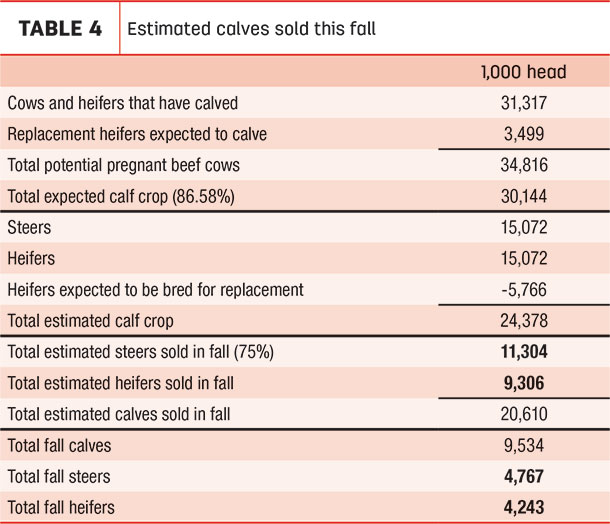
The number of calves affected was calculated using the January NASS inventory report. The calculations relied on a number of calculated assumptions detailed below.
1. The total calf crop was based on the 10-year average calf crop as reported in the NASS inventory report.
2. To find the average beef calf crop, dairy calves were subtracted from each year’s calf reported calf crop. This calculation assumed the reported calf crop included 65 calves from every 100 mature dairy cows reported the previous year.
3. The net calf crop, after subtracting a dairy calf allowance, was divided by the previous year’s beef cow inventory to yield a calf crop yield.
4. The prior-year beef cow inventory totaled beef cows that had calved plus replacement heifers expected to calve.
5. The 10-year average beef calf crop yield was 86.58%, meaning that every 100 cows and pregnant heifers produced 86.58 calves, on average, over the last 10 years.
6. Heifers held for replacement were subtracted from the calf crop. In this declining inventory stage of the cattle cycle, the most appropriate estimate for heifers kept for replacement is the previous year, which was 18.4% of beef cows and heifers that have calved.
Multiplying the total beef cows and pregnant heifers by 86.58% yielded an estimated calf crop. Subtracting the average heifer retention yielded the total expected beef calf crop sold. To allow for fall calves, steers were multiplied by 75% to yield the final estimated calves marketed this fall. Heifers were not adjusted. Calculations are shown in Table 4.
Financial effect
Feedlot sector
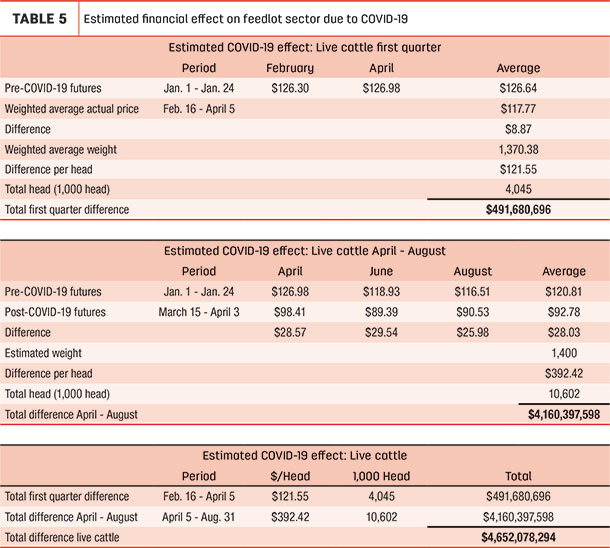
The market effect of COVID-19 was estimated by comparing price expectations before the initial outbreak in China to actual and anticipated prices after Feb. 15. COVID-19 affected two groups of feedlot cattle. As the public began to see the gravity of the outbreak, prices of cattle marketed in the first quarter after Feb. 15 were impacted. This affected prices of cattle on feed to be marketed in the April-August time frame to an even greater degree because they were placed prior to the outbreak under different price expectations and will now be marketed during a very difficult period for the country.
Live cattle futures before news of the COVID-19 outbreak in China were used to establish a baseline price expectation. Live cattle futures in early January reflected market price expectations for a “normal” year prior to the COVID-19 news breaking on Jan. 24. The live cattle futures price for all months during the trading period of Jan. 1 to Jan. 23, weighted for the three-year average proportion of animals marketed in each contract period, was $121.39. This was reasonable and within the range of multiple price models that estimated the annual average live steer price between $117 and $122.
Prices after the outbreak were calculated using weighted average price data for cattle marketed before April 4. Due to extreme uncertainty and volatility, price expectations for cattle marketed from April through the end of August were based on average price of the April, June and August contracts for the three weeks prior to April 4. The total price effect for the two groups was calculated to be $4.65 billion. Calculations are shown in Table 5.
Stocker/background sector
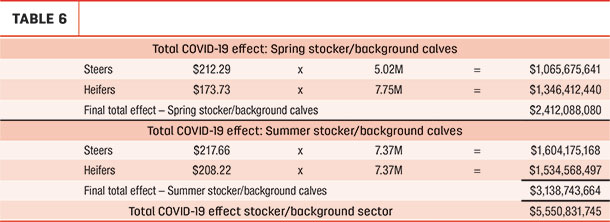
COVID-19 affected both cattle marketed in the spring and cattle marketed off grass in the fall.
The market effect of COVID-19 on the stocker and backgrounding sector was estimated by comparing price expectations before the outbreak in China to current anticipated prices using the BeefBasis.com forecasting model. This model estimates calf prices based on feeder cattle futures prices and is an accurate predictor of basis and cash prices.
Feeder cattle futures prices from Jan. 1 through Jan. 23 for the March, April and September contracts were used to establish a baseline price expectation. The most recent four-week average closing price of the same contracts from March 9 through April 3 was used to establish a post-COVID-19 futures price. Due to larger trading limits and more volatility, the four-week average price was considered more reliable than the three-week average used for baseline prices.
The BeefBasis.com model estimates prices for cattle in a given location based on date, sex, frame and muscling. Median marketing dates of April 1 and Sept. 1 were assumed for spring and fall stocker/background cattle, respectively. Price forecasts for 800-pound steers and 775-pound heifers in seven locations were calculated before and after COVID-19 affected the market, and a simple average of the seven locations was used to calculate a price expectations. The following seven locations were used in the price forecast analysis:
- Winter Livestock Auction – Dodge City, Kansas
- Joplin Regional Stockyards – Joplin, Missouri
- Torrington Livestock Market – Torrington, Wyoming
- Lexington Livestock Market – Lexington, Nebraska
- Oklahoma National Stockyards – Oklahoma City, Oklahoma
- Hub City Livestock – Aberdeen, South Dakota
- Stockmen’s Livestock Exchange – Dickinson, North Dakota
Feeder cattle prices can vary widely due to a number of factors, including location, sex and weight. These factors and others result in a wider basis variation than live cattle. Using the BeefBasis model to adjust forecast basis yields a more accurate price expectation than a simple average of the feeder cattle futures. For this analysis, the model was back tested against the CME Feeder Cattle Index through March to test price accuracy and ensure reasonably accurate results (Table 6).
Cow-calf sector
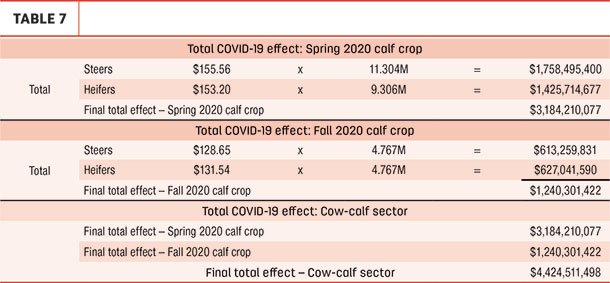
The number of calves affected was calculated using the NASS. Assuming 65 calves from every 100 dairy cows that have calved, the dairy calf crop was subtracted from the NASS calf crop estimate to yield a beef calf crop. This analysis relied on the following assumptions:
1. Spring calves were assumed to comprise 75% of the calf crop and fall calves 25%.
2. Spring calves were assumed to be sold in October, with steers and heifers weighing 500 and 480 pounds, respectively.
3. Fall calves were valued as of Jan. 15, 2021, with steers and heifers weighing 400 and 380 pounds, respectively. Replacement heifers were not subtracted from fall calves.
4. Before and after prices were forecasted using the BeefBasis model.
5. Pre-COVID prices were based on the average October and January futures prices. October futures were based on prices through Feb. 14. The average for fall calves was based on the January 2021 contract prices during the month of February, as that was the first month the contract traded.
6. Current price forecasts were based on the average closing price for the respective contracts from March 9 through April 3.
7. Prices were estimated and averaged for the same locations as the stocker analysis, using the same calculations to derive expected market impacts (Table 7).
Distribution
The most accurate funding distribution model indemnifies each operation for inventory on hand as of Feb. 15. Verification can include the following:
1. Sales receipts
2. Balance sheets submitted to banks, adjusted to Feb. 15 with sales receipts
3. Inventory appraisals by certified appraisers or lenders, adjusted to Feb. 15 with sales receipts
4. Brand inspections
5. Vet records
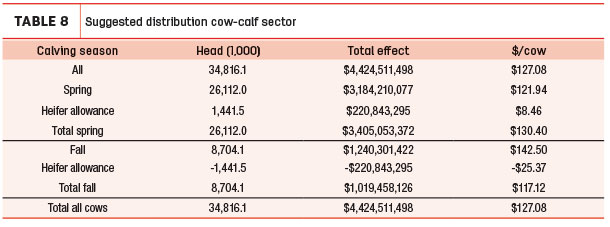
Cow-calf sector
Because calf crops vary by operation, the best way to distribute funding to the cow-calf sector is on a per-cow basis. The breakout between spring- and fall-calving cows should include adjustments for heifer retention, assigning 25% of the heifers expected to calve per the NASS inventory report to the fall calving subsector. Any calf born after Aug. 1 is considered a fall calf. The payout per cow is calculated in Table 8.
Stocker/backgrounding sector
Stocker indemnity should likewise be broken out on a per-head basis, regardless of sale weight. The breakout between spring and summer calves can be based on sales receipts, with June 1 as the date determining marketing class
Feedlot sector
Feedlot sector payouts can be based on actual receipts or feed receipts.
Summary
While no forecast is perfect, the methods and calculations described in this report represent an accurate forecast per currently available information. Current information is, however, the only information available, and this forecast is based on fundamentally sound methodology. Therefore, this forecast is as accurate as possible at present.
Forecasts can be refined and adjusted as the markets refine and process the actual effect on beef demand and the supply chain. As the pandemic works through the population and the economy, the actual impact will almost certainly differ from any current forecast. The trend continues downward for both cash and futures markets, so the estimated impact is more likely to understate the actual impact than overstate it. ![]()
This report was released in cooperative work with the U.S. Cattlemen’s Association along with Brett Crosby, who is with Custom Ag Solutions.
—Excerpts from Custom Ag Solutions BeefBasis newsletter


