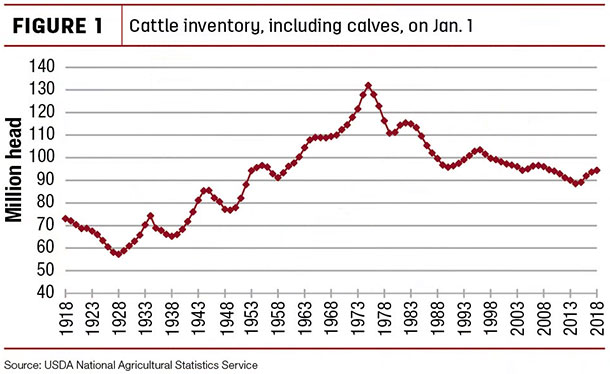
Compared to last year, cow-calf producers are indicating their intentions to retain 237,000 fewer beef heifers (-3.7 percent) for breeding in their herds. Overall, the U.S. herd is still relatively low, down from its all-time peak of 132 million in 1975 and up from its recent low of 88.5 million head in 2014, and has expanded at a slower pace. The report also included a number of revisions to the Jan. 1, 2017, inventory classes.
The January 2017 cattle and calf inventory was 93.7 million head, which showed 1.9 percent growth from 2016, whereas the inventory grew 3.1 percent from 2015 to 2016. In addition, the 2017 calf crop was revised downward by 492,000 head from the July 1 Cattle report to 35.8 million calves.
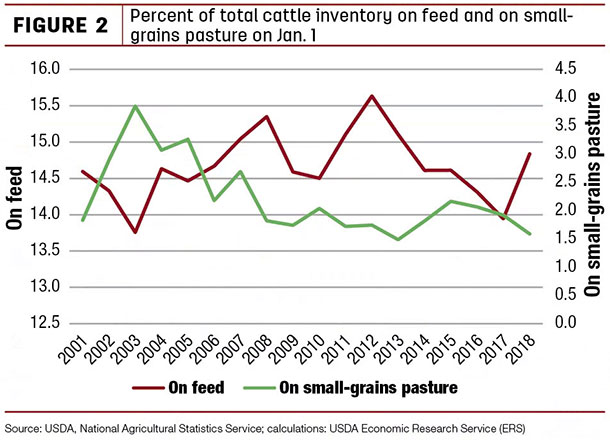
The Cattle report also indicated fewer cattle on small-grains pastures than in 2017. The estimate of 1.5 million head on small-grains pastures on Jan. 1, 2018, was 16.7 percent below the 1.8 million head reported last year. This level of small-grains pasturing is likely, in part, reflecting drought conditions in the Southern Plains. To a degree, it likely bolstered the number of cattle on feed in all U.S. feedlots, which was up by 939,000 head (+7.2 percent) to 14 million head on Jan. 1 from last year.
As illustrated in Fgure 2, though the percent of total cattle inventory on small-grains pastures showed some recovery from the 2011-12 drought, it has begun to decline in recent years.
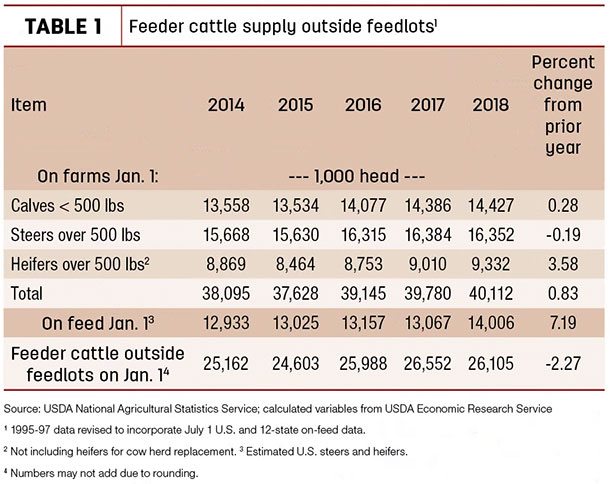
Further, as a result of some cattle likely moving from pastures to feedlots, the number of cattle available to place in feedlots in 2018 was 2.3 percent (447,000 head) lower than last year (see Table 1).
Demand strength to continue in first half of 2018
Despite one less slaughter day in the calendar year, the NASS Livestock Slaughter report indicated 2017 beef production increased 3.8 percent year-over-year to 26.2 billion pounds. The forecast for 2018 beef production was revised downward by 35 million pounds to 27.7 billion pounds but remains nearly 6 percent higher than 2017. This change reflects lighter anticipated placements and fewer steers and heifers slaughtered in 2018.
This winter, there are roughly 300,000 fewer cattle on small-grains pastures compared to last year. More cattle were placed in feedlots during the fourth quarter of 2017, according to the January NASS Cattle on Feed report. Some of these cattle may have normally been grazed on winter pasture and, to the extent they were placed earlier, some that were expected to be slaughtered in second-half 2018 are now anticipated to be slaughtered in the first half.
In a typical graze-out period, more cattle would be placed on feed late in the first quarter and marketed in the second half of the year. The timing and weight of placements in the coming months will increasingly depend on precipitation in the Southern Plains.
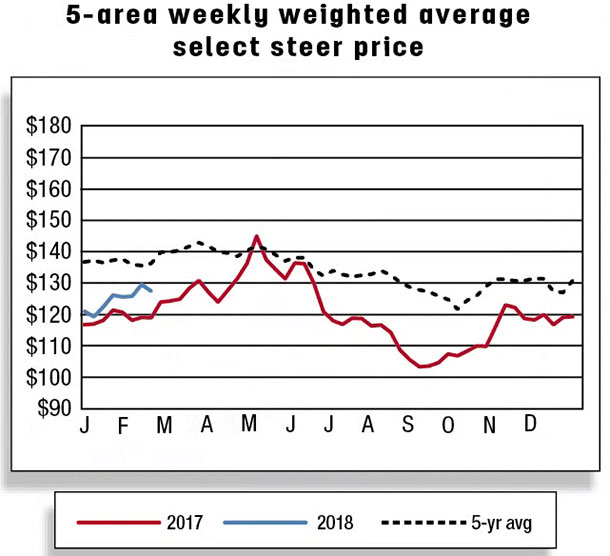
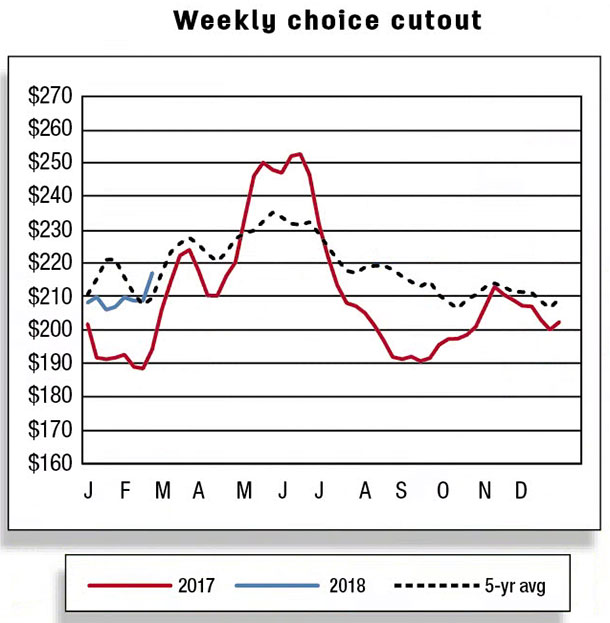
Despite higher cattle slaughter and beef production during January 2018 relative to January 2017, wholesale beef prices climbed above 2017. With packers’ margins above 2017 in early 2018, January fed-steer prices also averaged above year-earlier levels.
On expectations of continued demand strength, fed-steer price forecasts for the first and second quarters were raised to $122 to $126 per hundredweight and $117 to $125 per hundredweight, respectively. Although first-quarter fed-steer prices are expected to average above 2017, second-quarter prices could be pressured by marketings. The 2018 quarterly price forecasts for feeder steers were left unchanged.
2017 beef export volume largest ever; second consecutive year of double-digit growth
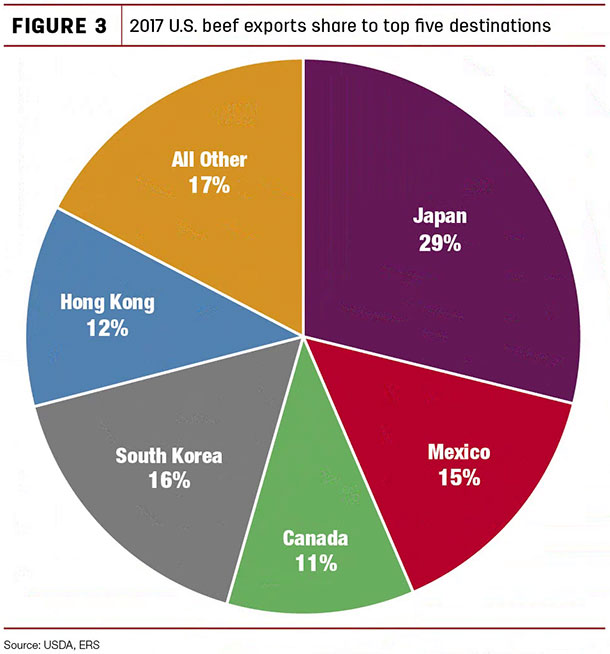
In 2017, U.S. beef exports increased 306 million pounds (+12 percent) year-over-year to 2.9 billion pounds. This is the second consecutive year of double-digit export growth, with volumes reaching record levels. Sustained demand in Asian markets contributed to these volumes with double-digit growth to Japan (26 percent) and Hong Kong (14 percent). The top five export destinations captured about 83 percent of all U.S. beef exports (see Figure 3).
The forecast for 2018 beef exports was revised upward by 40 million pounds from the previous month’s forecast to 3 billion pounds based on continuing strong demand in overseas markets and the weakening of the U.S. dollar in the beginning of 2018.
The U.S. dollar trade index has dropped to the lowest level since June 2015, making U.S. products more attractive in foreign markets. Reflecting a continued tightness of beef availability from Oceania, increased U.S. shipments are expected to go mainly to Asian markets.
U.S. beef imports slightly down in 2017
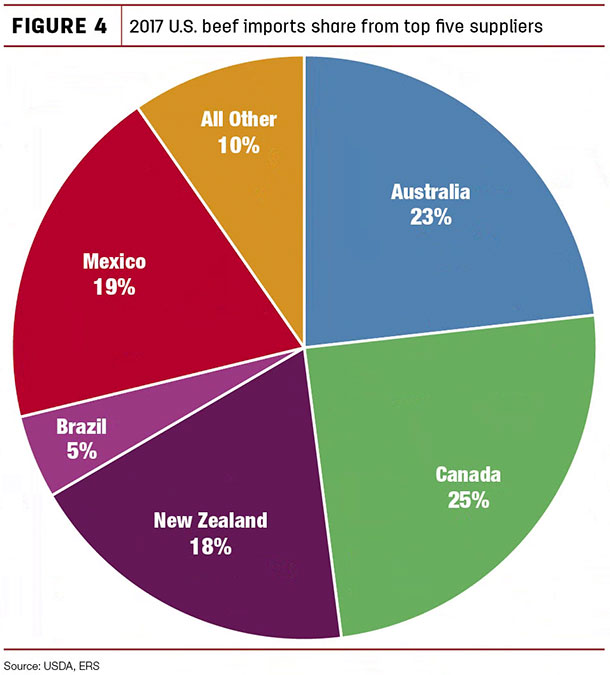
Beef imports in 2017 were down slightly (-20.3 million pounds) from year-earlier levels to just under 3 billion pounds. Lower-than-expected beef imports reflect tighter beef supplies from Oceania due to prolonged drought and continued herd rebuilding. Some of the decline in lean beef imports was offset by higher U.S. cow slaughter. U.S. reductions in imports were from Australia (-71.9 million pounds), New Zealand (-55.5 million pounds) and Brazil (-14.3 million pounds), while there were increases from Mexico (+80 million pounds), Canada (+23 million pounds) and Nicaragua (+22 million pounds).
Overall, five countries supplied more than 90 percent of the U.S. beef import supply (see Figure 4). The import forecast for 2018 is unchanged from the previous month.
Cattle export growth in 2018 to continue
Cattle exports in 2017 more than doubled from 2016 levels to 192,984 head, mainly due to increased exports to Canada. Exports to Canada were more than double from 2016 in each month of 2017, resulting in a 289 percent increase from 37,340 head in 2016 to 145,284 head in 2017.
The relative weakening of the trade-weighted U.S. dollar and higher feeder cattle prices in Canada relative to the U.S. during October and November supported greater U.S. shipments to Canada. Exports to Mexico were only slightly higher in 2017 from the previous year.
U.S. cattle shipments to other destinations, mainly Turkey, Vietnam and Qatar, increased fourfold above year-earlier levels to 17,981 head (up by 14,479 head) in 2017. Based on the strong pace of exports during the end of the year and the weakening of the U.S. dollar in the beginning of 2018, the 2018 cattle export forecast was increased by 10,000 head from January’s forecast to 200,000 head.
U.S. cattle imports in 2017 totaled 1.8 million head, up 97,681 head (+5.7 percent) from the previous year. The 16 percent decline from Canada (-122,466 head) was outweighed by a year-over-year 23 percent increase in imports from Mexico (+220,150 head).
Higher feeder cattle prices in the U.S. during late spring and summer 2017, along with an increased cattle supply in Mexico, likely increased Mexican shipments. The 2018 cattle import forecast is unchanged from the previous month’s forecast. ![]()
Analyst Lekhnath Chalise assisted with this report.
References omitted but available upon request. Click here to email an editor.