Evidence supportive of herd expansion was observed in the increased year-over-year retention of replacement heifers for addition to the breeding herd in the NASS cattle report released on Jan. 31, 2014.
Additional evidence appeared earlier with the lowest heifer share of total steers and heifers on feed since 2006 observed in the NASS cattle on feed report released Jan. 24, 2014.
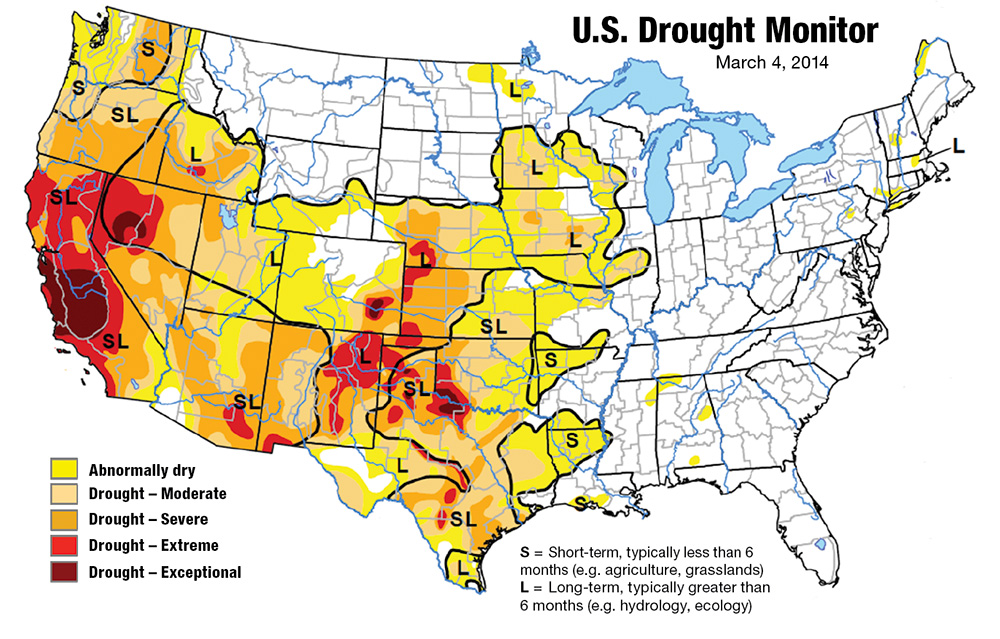
Weather continues to work against increases in cattle inventories in some areas, like California and the Southwest where drought continues to adversely affect inventory management.
Further, while cow-calf producers have recently enjoyed some of the highest cow and calf prices ever observed, costs have increased as well.
As a result, profit margins, while positive, have not increased to the extent that recent feeder cattle prices might imply.
The Jan. 1, 2014 total cow inventory declined by 1 percent year over year.
Except for 2004-2006, the January 2014 inventory represents the 16th year of decline since cow inventories began their drought-induced drop from the 1996 inventory peak.
Since 1975, total cow inventories have increased cyclically three times. Each cyclical peak was lower than the previous peak.
The last increase occurred in 2004 and 2005 – a modest increase of only 287,000 head, an increase of about 0.7 percent from the 2004 low of 41.519 million head – before continuing the longer-term decline.
As with cow-calf production, incentives to motivate expansion of cattle inventories are not obvious from other levels in the beef production process.
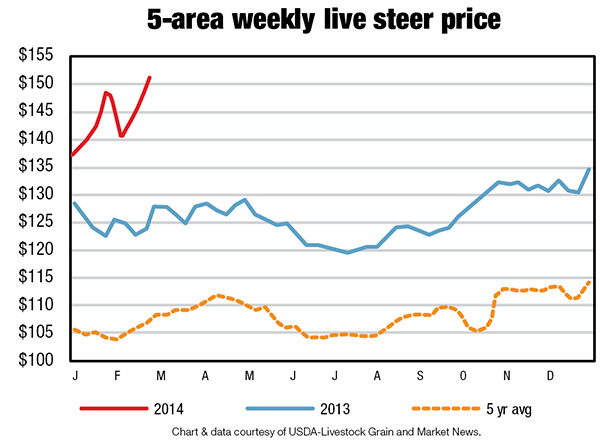
Rapidly increasing feeder cattle prices and packer losses have generally constrained increases in fed cattle prices and cattle feeding margins until recently.
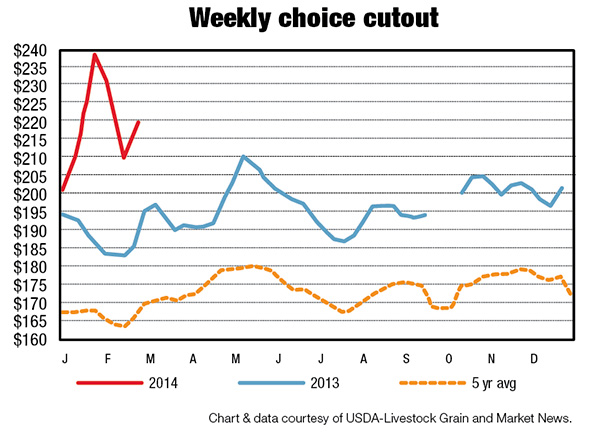
Despite rapidly declining feed costs, cattle feeding had been at or below breakeven levels since April 2011. Cutout values had been constrained, likely in part by lackluster consumer demand.
Packers had been squeezed between fed cattle prices that had often increased faster than beef cutout values increased.
With both fed cattle prices and wholesale cutout values moderating somewhat from recent record levels, profit margins for both cattle feeders and meatpackers will likely decline somewhat from their recent highs.
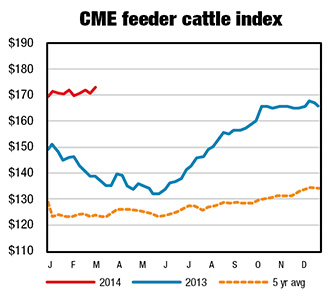
At the same time, the current significantly positive margins will motivate cattle feeders to feed cattle. Already, there are signs of this response by cattle feeders in the slight year-over-year increase in December feeder cattle placements in 1,000-plus-head feedlots (NASS, cattle on feed).
A further result will be that high feeder cattle prices driven by cattle-feeder demand will likely become increasingly important in cow-calf producers’ decisions to either retain heifers for breeding or increase current income by selling those heifers as feeders.
Heifers switched from replacement to feeder cattle would likely dampen feeder cattle prices and eventually wholesale and retail beef prices as the extra heifers transformed into extra beef.
With normal weather and other conditions, total beef supplies could begin to increase above current levels as soon as 2016, although perhaps not significantly until sufficient heifers have been added to the herd to provide the calves needed to increase beef production.
However, historically low inventories of beef cattle will likely provide the cattle-beef sectors their best opportunities for financial recovery over the next two to three years. The NASS has announced the reinstatement of the July cattle report, which will provide an indication of producer expansion intentions at midyear.
Do low cow inventories mean less beef?
Since 1975, increases in production technologies have increased the output per cow and have reduced the need for a national cow herd as large as the 1975 herd.
On Jan. 1, 1975, cow inventory peaked a record 56.9 million head, and in 1976, commercial beef production reached its cyclical peak of 25.7 billion pounds.
Cow inventories then declined to 47.9 million cows on Jan. 1, 1979, and beef production declined to 21.5 billion pounds in 1980. Since 1980, beef production has increased cyclically, almost reaching its 1976 level again in 1998.
Production surpassed the 1976 peak in 1999 and has generally exceeded it since reaching a new record of 27.1 billion pounds in 2002. In 2013, beef production was about 5 percent below 1976 production, but the cow inventory on Jan. 1, 2013, was 32 percent lower than the 1975 peak.
The relatively high levels of beef production per cow have been possible for several reasons. Dressed weights of cattle have increased partially as a result of genetic selection for larger weaning and yearling weights, resulting in larger slaughter and mature weights along with improvements in feeds and feeding technologies and management and animal health and well-being.
For example, dressed weights of federally inspected steers have increased significantly from a yearly average of 673 pounds in 1975 to a record 864 pounds in 2013, a 28 percent increase.
Increased cattle imports, both in number and size, have also contributed to the increase in beef production. Cattle imports have increased from about one million head in the early 1970s to about two million head in 2013.
These imported cattle have also become larger over time for the same reasons as U.S. cattle, further contributing to increasing beef supplies.
Despite generally declining cattle inventories, increases in beef production since the mid-1970s have not completely offset population growth.
As a result, per-capita beef disappearance has generally declined. Retail per-capita disappearance peaked in 1976 at 94.4 pounds and has since declined steadily to 56.4 pounds in 2013.
Many factors have contributed to the per-capita declines, including increased exports, but also factors affecting domestic demand such as health perceptions and increases in consumption of other meat and seafood.
Largely as a result of historically low inventories, reduced placements of feeder cattle – especially heifers – in feedlots and reduced cow slaughter, beef production is expected to decline further in 2014 and perhaps a few years beyond.
Coupled with increases in population, these tighter supplies of beef are expected to result in further declines in per-capita disappearance.
Cattle imports decline in 2013
U.S. cattle imports in 2013 totaled 2.028 million head, a decline of 11.2 percent from 2012. Imports fell due to slowing shipments from Mexico (-32.6 percent), despite higher shipments from Canada (+27.5 percent).
Over the past several years, severe drought conditions in Mexico led to herd liquidation and strong exports to the U.S. Cattle inventories are now at historic lows in Mexico while pasture conditions have improved.
Balancing some of the loss in shipments from Mexico, imports from Canada rose to 1.04 million head in 2013. Feeder cattle imports from Canada rose 113 percent year over year.
However, the addition of 190,000 head from Canada was not enough to offset an import decline of 477,000 head of feeder cattle from Mexico.
U.S. cattle imports are expected to decline in 2014 to 1.95 million head, 4 percent lower than in 2013. Lower imports from Mexico are likely to continue, as it will take several years for herds to recover.
Continued strength in imports from Canada is likely, as feeder cattle demand will be strong due to tight supplies in the U.S.
Beef exports show strong growth, imports moderately higher in 2014
U.S. beef exports rose 5 percent in 2013 to 2.583 billion pounds. Exports to Asia were strong, with large increases in shipments to Japan (+49 percent) and Hong Kong (+71 percent).
Exports to Japan climbed to the highest total since 2003, the year that the first U.S. case of bovine spongiform encephalopathy (BSE) was discovered.
In February 2013, Japan relaxed import restrictions to allow for meat from cattle aged 30 months or younger, altering the previous policy, which had been in place since 2006.
Exports to Hong Kong continued to grow during 2013, following a trend that has seen exports grow at an average annual rate of 68 percent over the past five years.
Higher exports to Japan and Hong Kong more than offset weaker exports to Vietnam and the loss of Russia, which banned U.S. beef imports early in 2013 due to ractopamine use. Canada and Mexico remained among the top destinations for U.S. beef in 2013. While exports to Canada fell slightly, shipments to Mexico rose 15 percent.
After averaging 564 million pounds on an annual basis between 2002 and 2011, exports dropped in 2012 due to higher beef production in Mexico. Shipments partially recovered in 2013 but lagged historical trade.
Total U.S. beef exports are forecast to fall in 2014 to 2.335 billion pounds, a decline of 10 percent year over year. Despite growing demand for beef in Asia, further growth in U.S. exports will be challenged by the expected 5 percent decline in production in 2014, which will bring production to the lowest level since 1994.
U.S. beef imports rose 1 percent in 2013 to 2.25 billion pounds. Australia was the top supplier for U.S. beef imports last year despite an overall decline in volume.
Canada followed with imports nearly unchanged from 2012. Shipments rose from New Zealand (+6 percent), Brazil (+29 percent), and Uruguay (+14 percent).
Overall, U.S. beef imports in 2014 are forecast to rise 2 percent to 2.285 billion pounds. Beef production in the U.S. is expected to decline this year due to lower cattle supplies, higher heifer retention and reduced cow slaughter, likely as herd rebuilding begins. While lower domestic production should increase demand for imports, growth will be challenged by rising beef demand in Asia.
Higher incomes in much of Asia and the Middle East are increasing competition for globally traded beef. While beef production and exports rose in Australia during 2013, U.S. imports of Australian beef fell 5 percent.
In 2013, Australian exports to China increased over 300 percent year over year, and China’s market share of Australian exports rose from 3 percent in 2012 to just over 13 percent. ![]()
Lindsay Kuberka is an analyst for cattle and beef international trade at USDA-ERS.
Kenneth Mathews
Livestock Economist
USDA